Barbie beats Oppenheimer at the box office - and on Cash App too
Cash App is a vital part of the US economy, providing a crucial tool for people to send and receive Peer to Peer (P2P) payments, obtain a free debit card, and even buy and sell bitcoin and stocks.
As data scientists, we’re especially psyched about our robust dataset which gives us an exciting glimpse into how people use Cash App to split rent, pay for goods and services, donate to charities, and much more.
With the release of Barbie and Oppenheimer last month setting new box office records, we were curious how often our customers mentioned these films in notes associated with their P2P payments over the past month. Barbie beat Oppenheimer by a ratio of 2:1 in its opening weekend - do we see a similar pattern on Cash App?
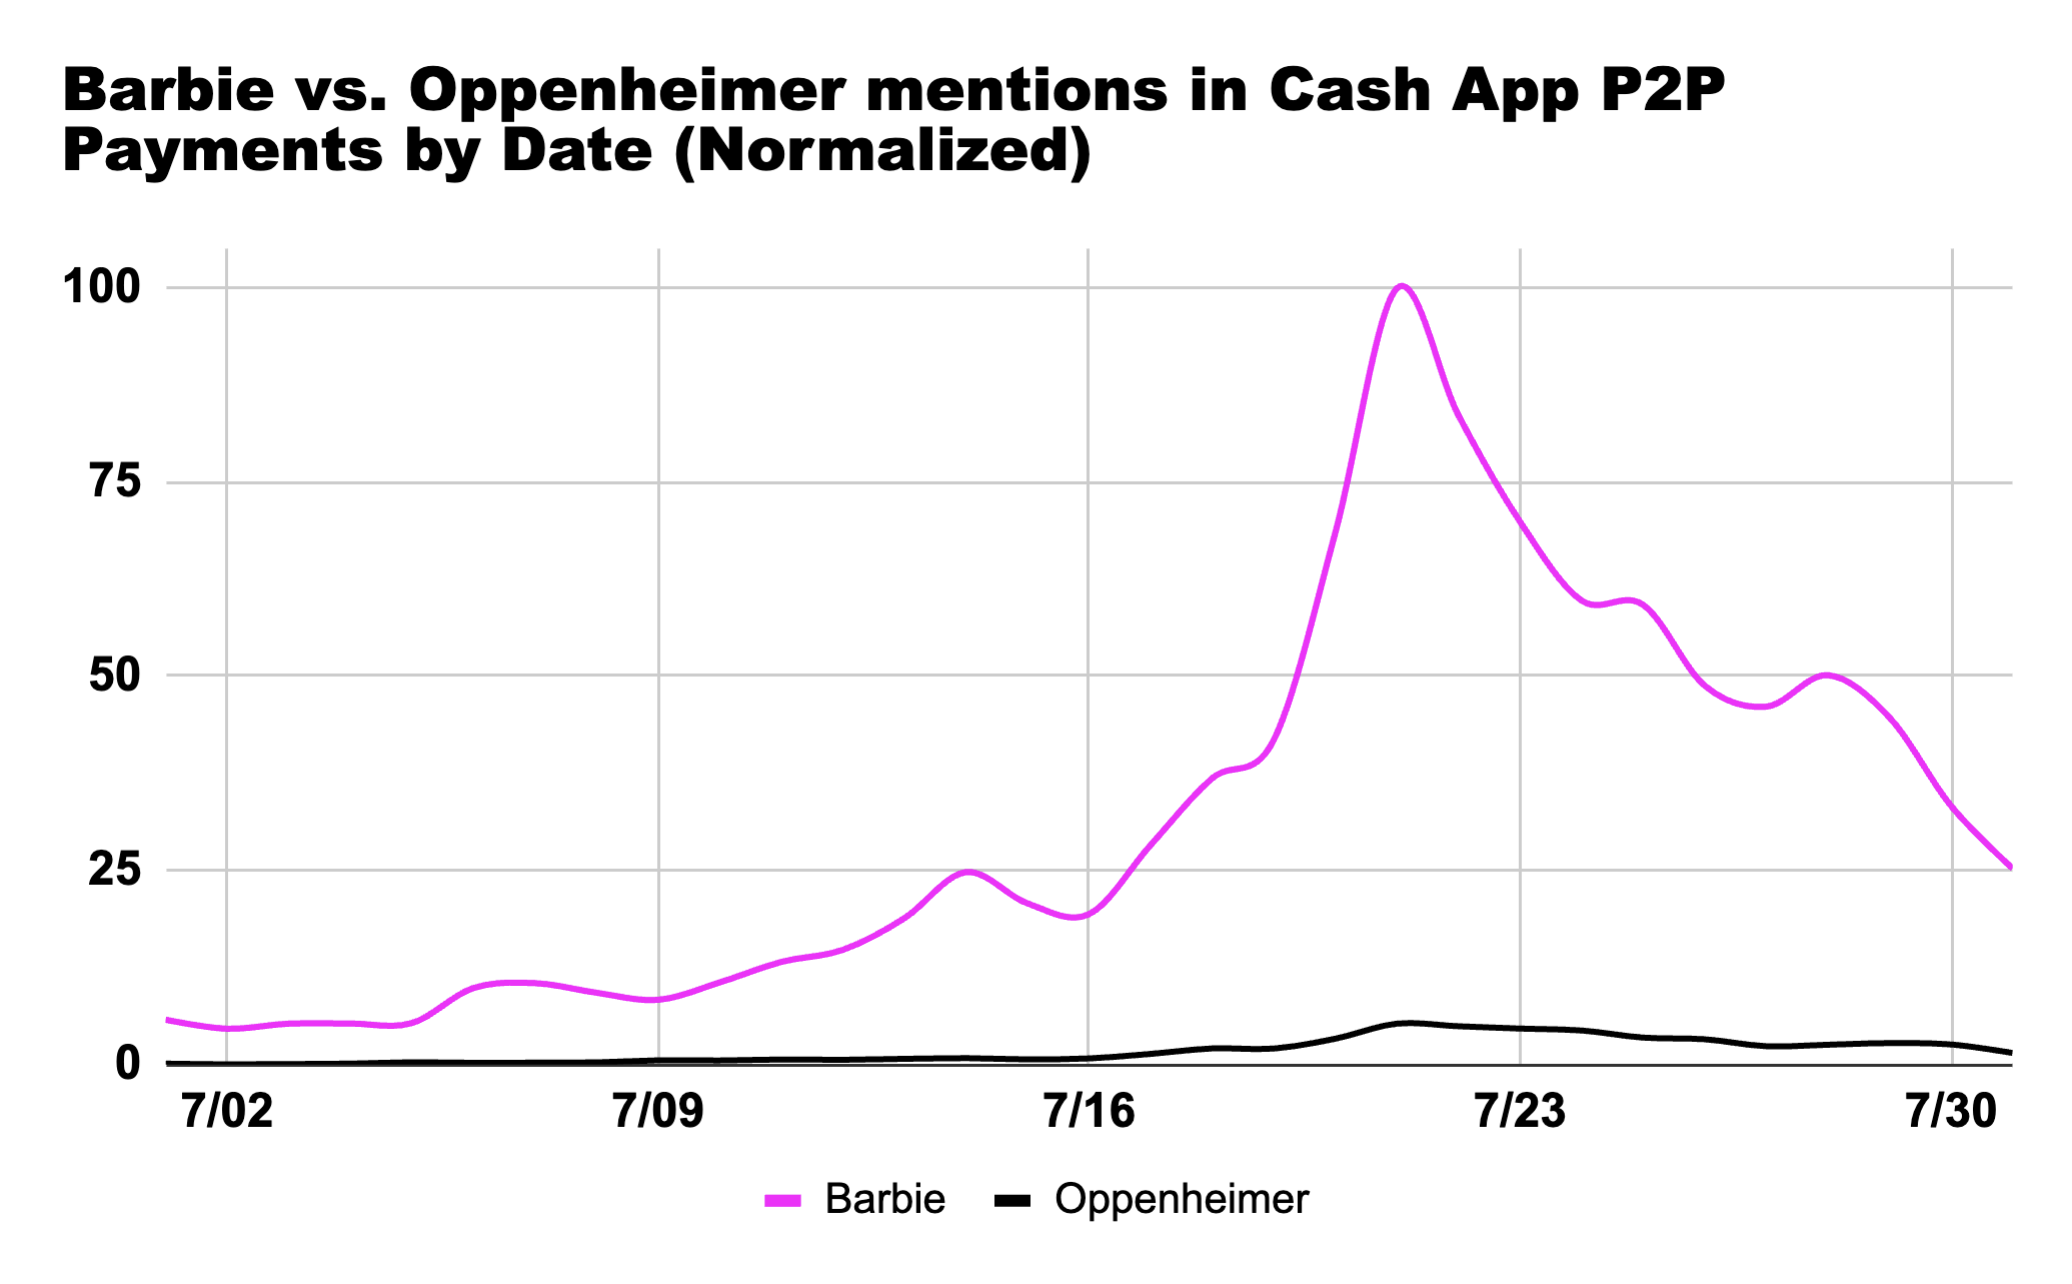
We obtained a dataset of anonymized and aggregated mentions of Barbie and Oppenheimer in payment notes and discovered that, in the month of July, our customers were 18 times as likely to mention Barbie as they are Oppenheimer. We also see Barbie payments spiked exactly on the release date of Friday, July 21. (Oppenheimer payments also spiked on the same date, but at much smaller volumes.)
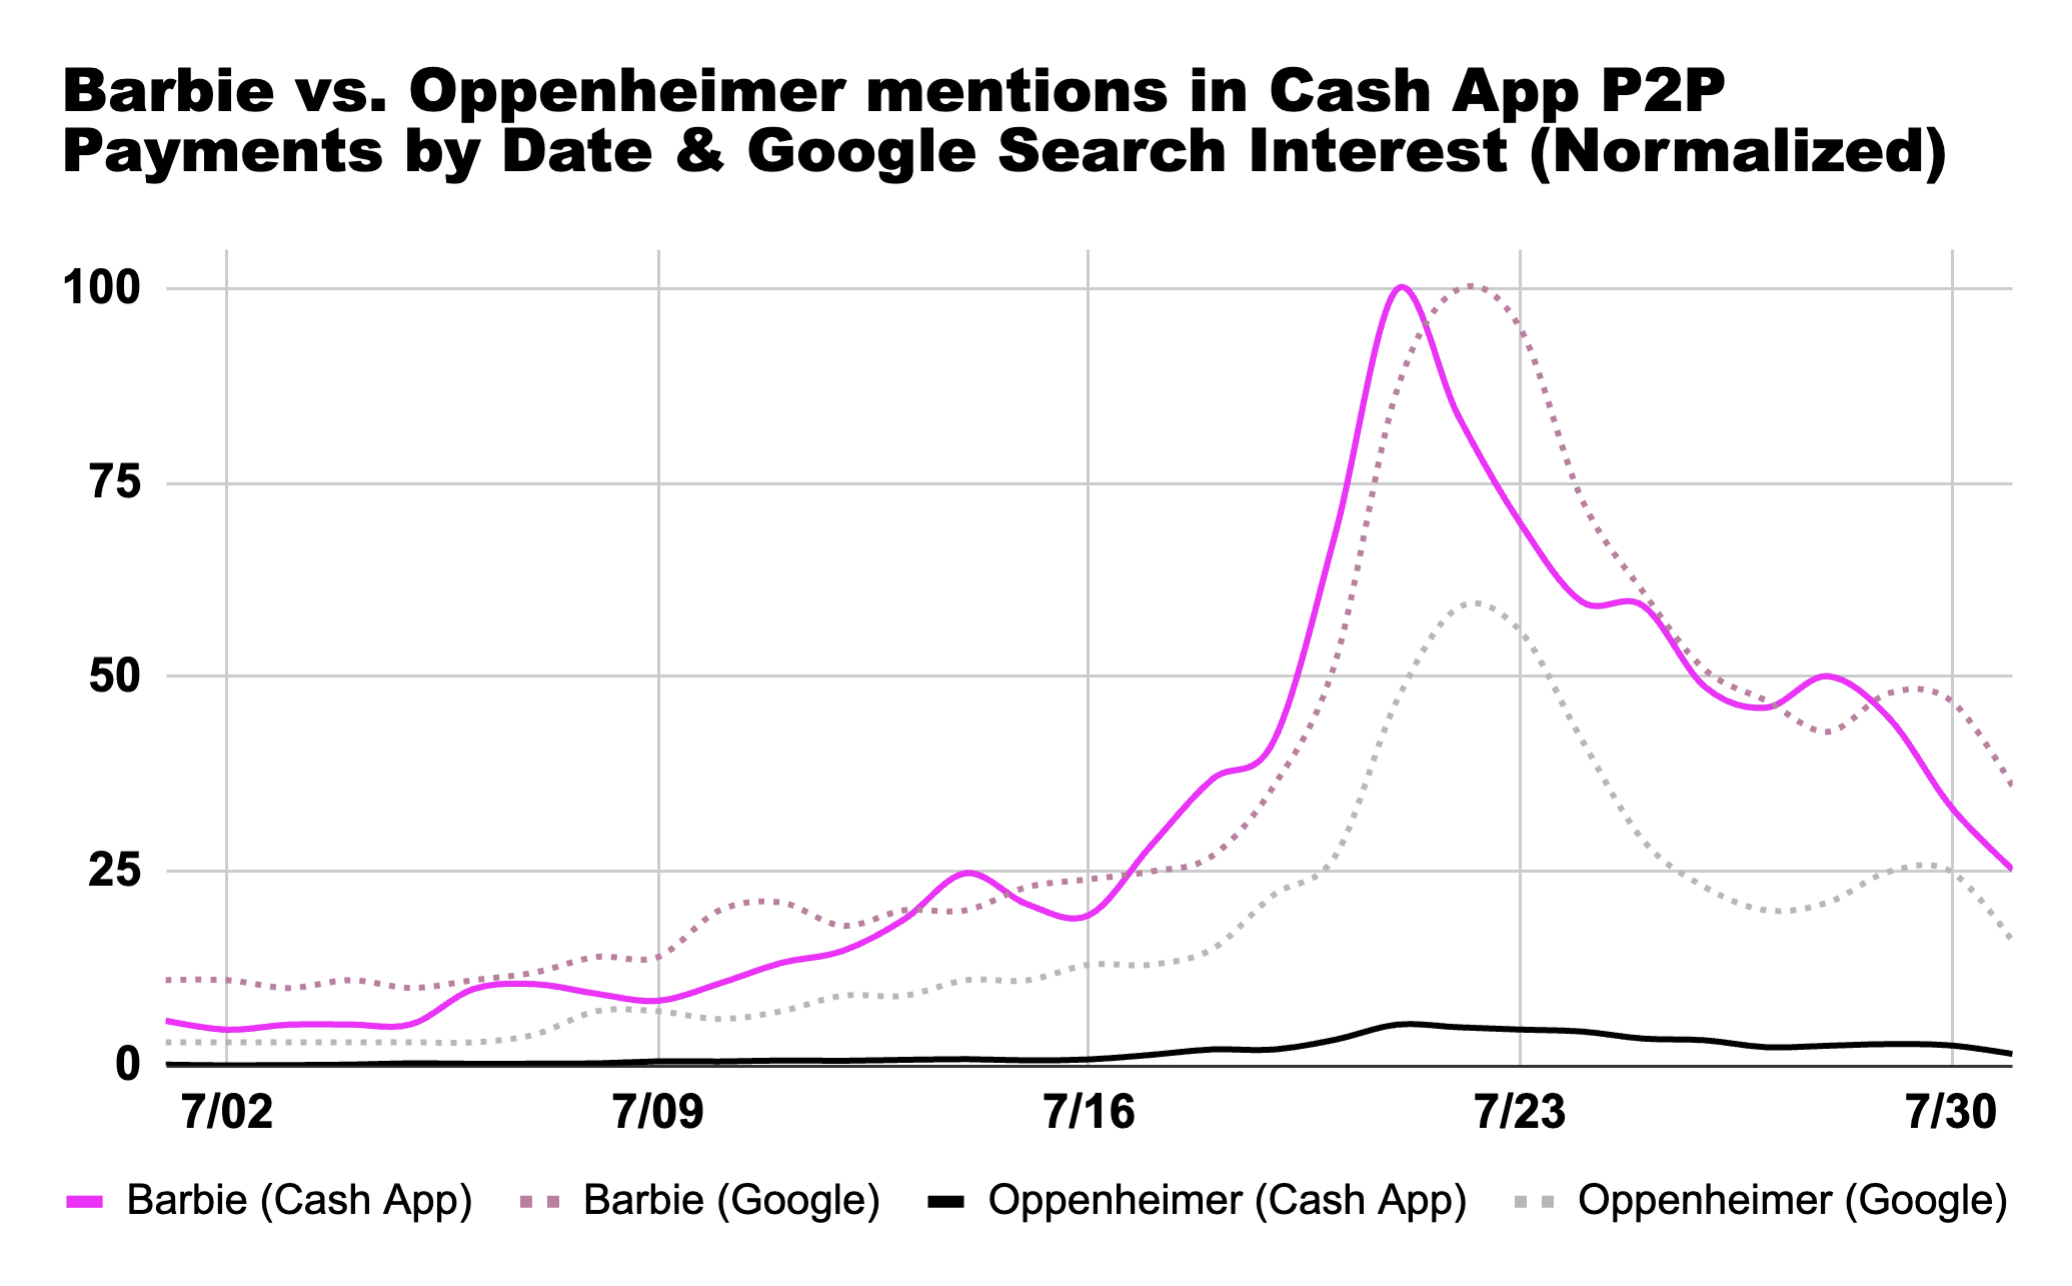
We can also compare Cash App P2P payments data with Google Search Trends data. For Barbie, we find the two curves tracking each other remarkably closely throughout July, with Google trailing Cash App and peaking a day later.

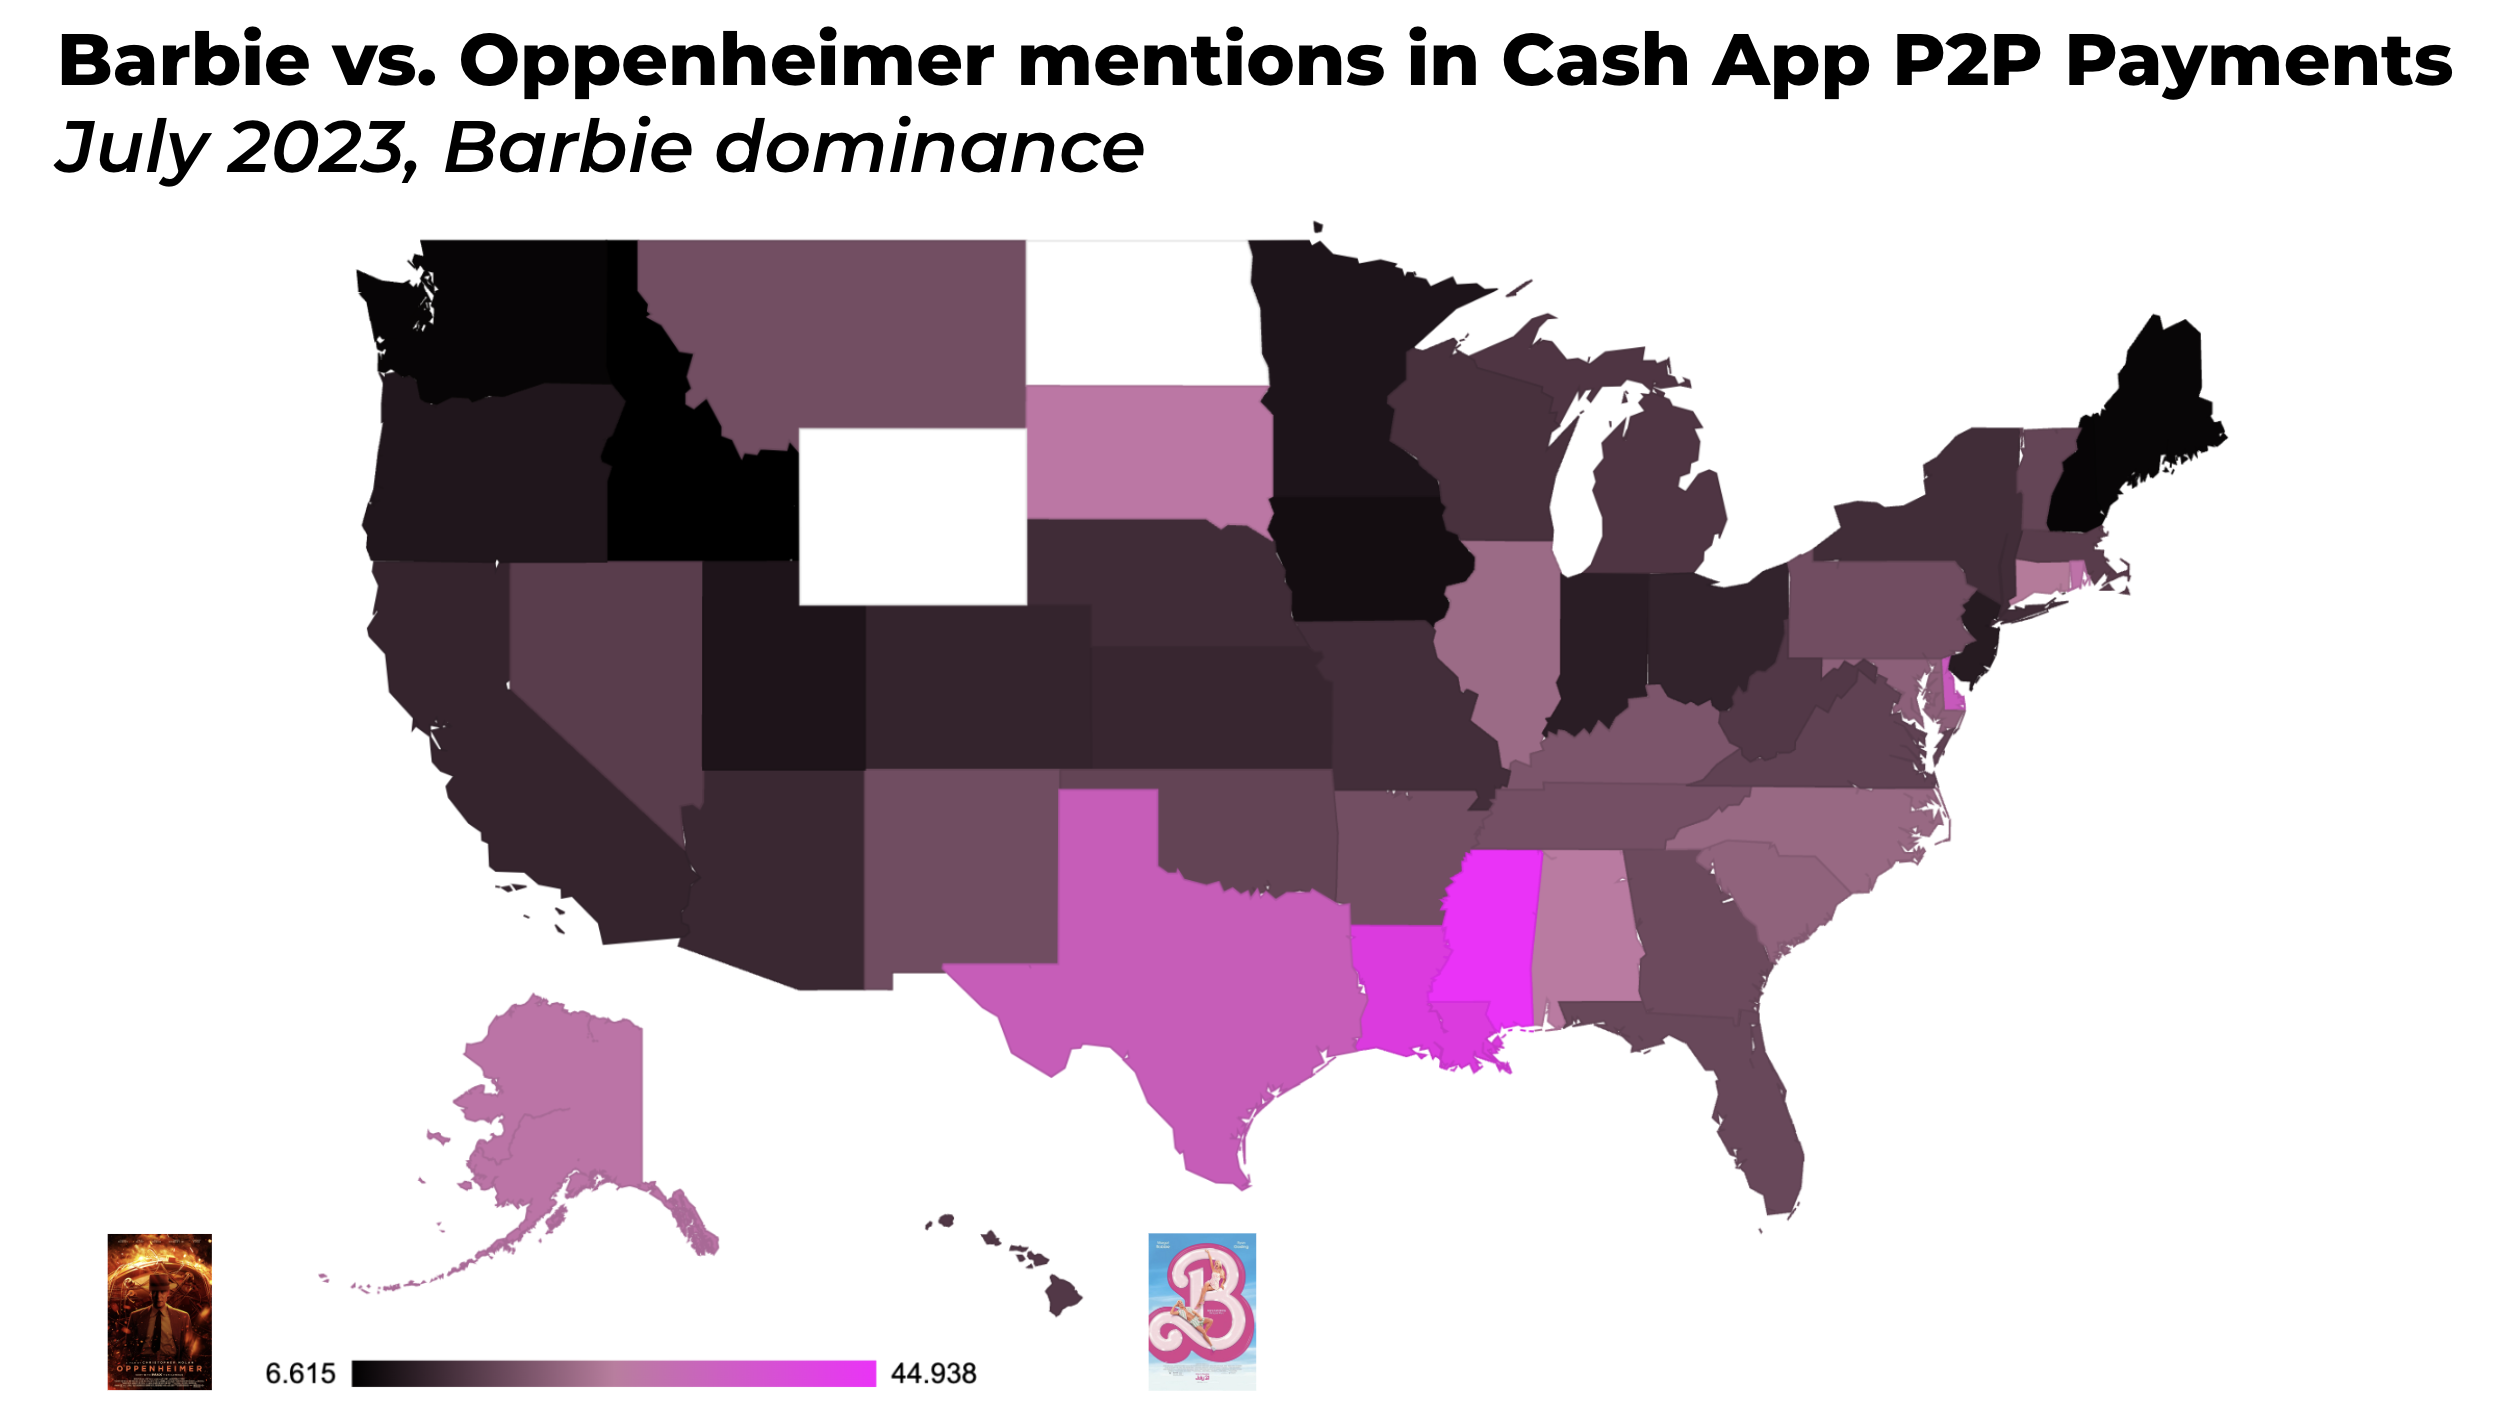
We can also look at data by state - now, we already know that Barbie is 18 times as prevalent than Oppenheimer in our dataset, and indeed, Barbie’s dominance holds true in every state. However, we can examine heterogeneity in these Barbie dominance scores by state to understand where she has her strongest base of support.
We find the strongest Barbie belt in the South, extending from Mississippi (45x dominance), to Louisiana (40x dominance), and Texas (32x dominance). (Delaware is the only strongly pink state outside this belt.)
Meanwhile, Oppenheimer’s base of support is anchored in the North and the West, and is especially strong in Washington, Idaho, and New Hampshire. (Note that Barbie is still dominant in all these states, but at ~7x, compared to her national average of ~18x).
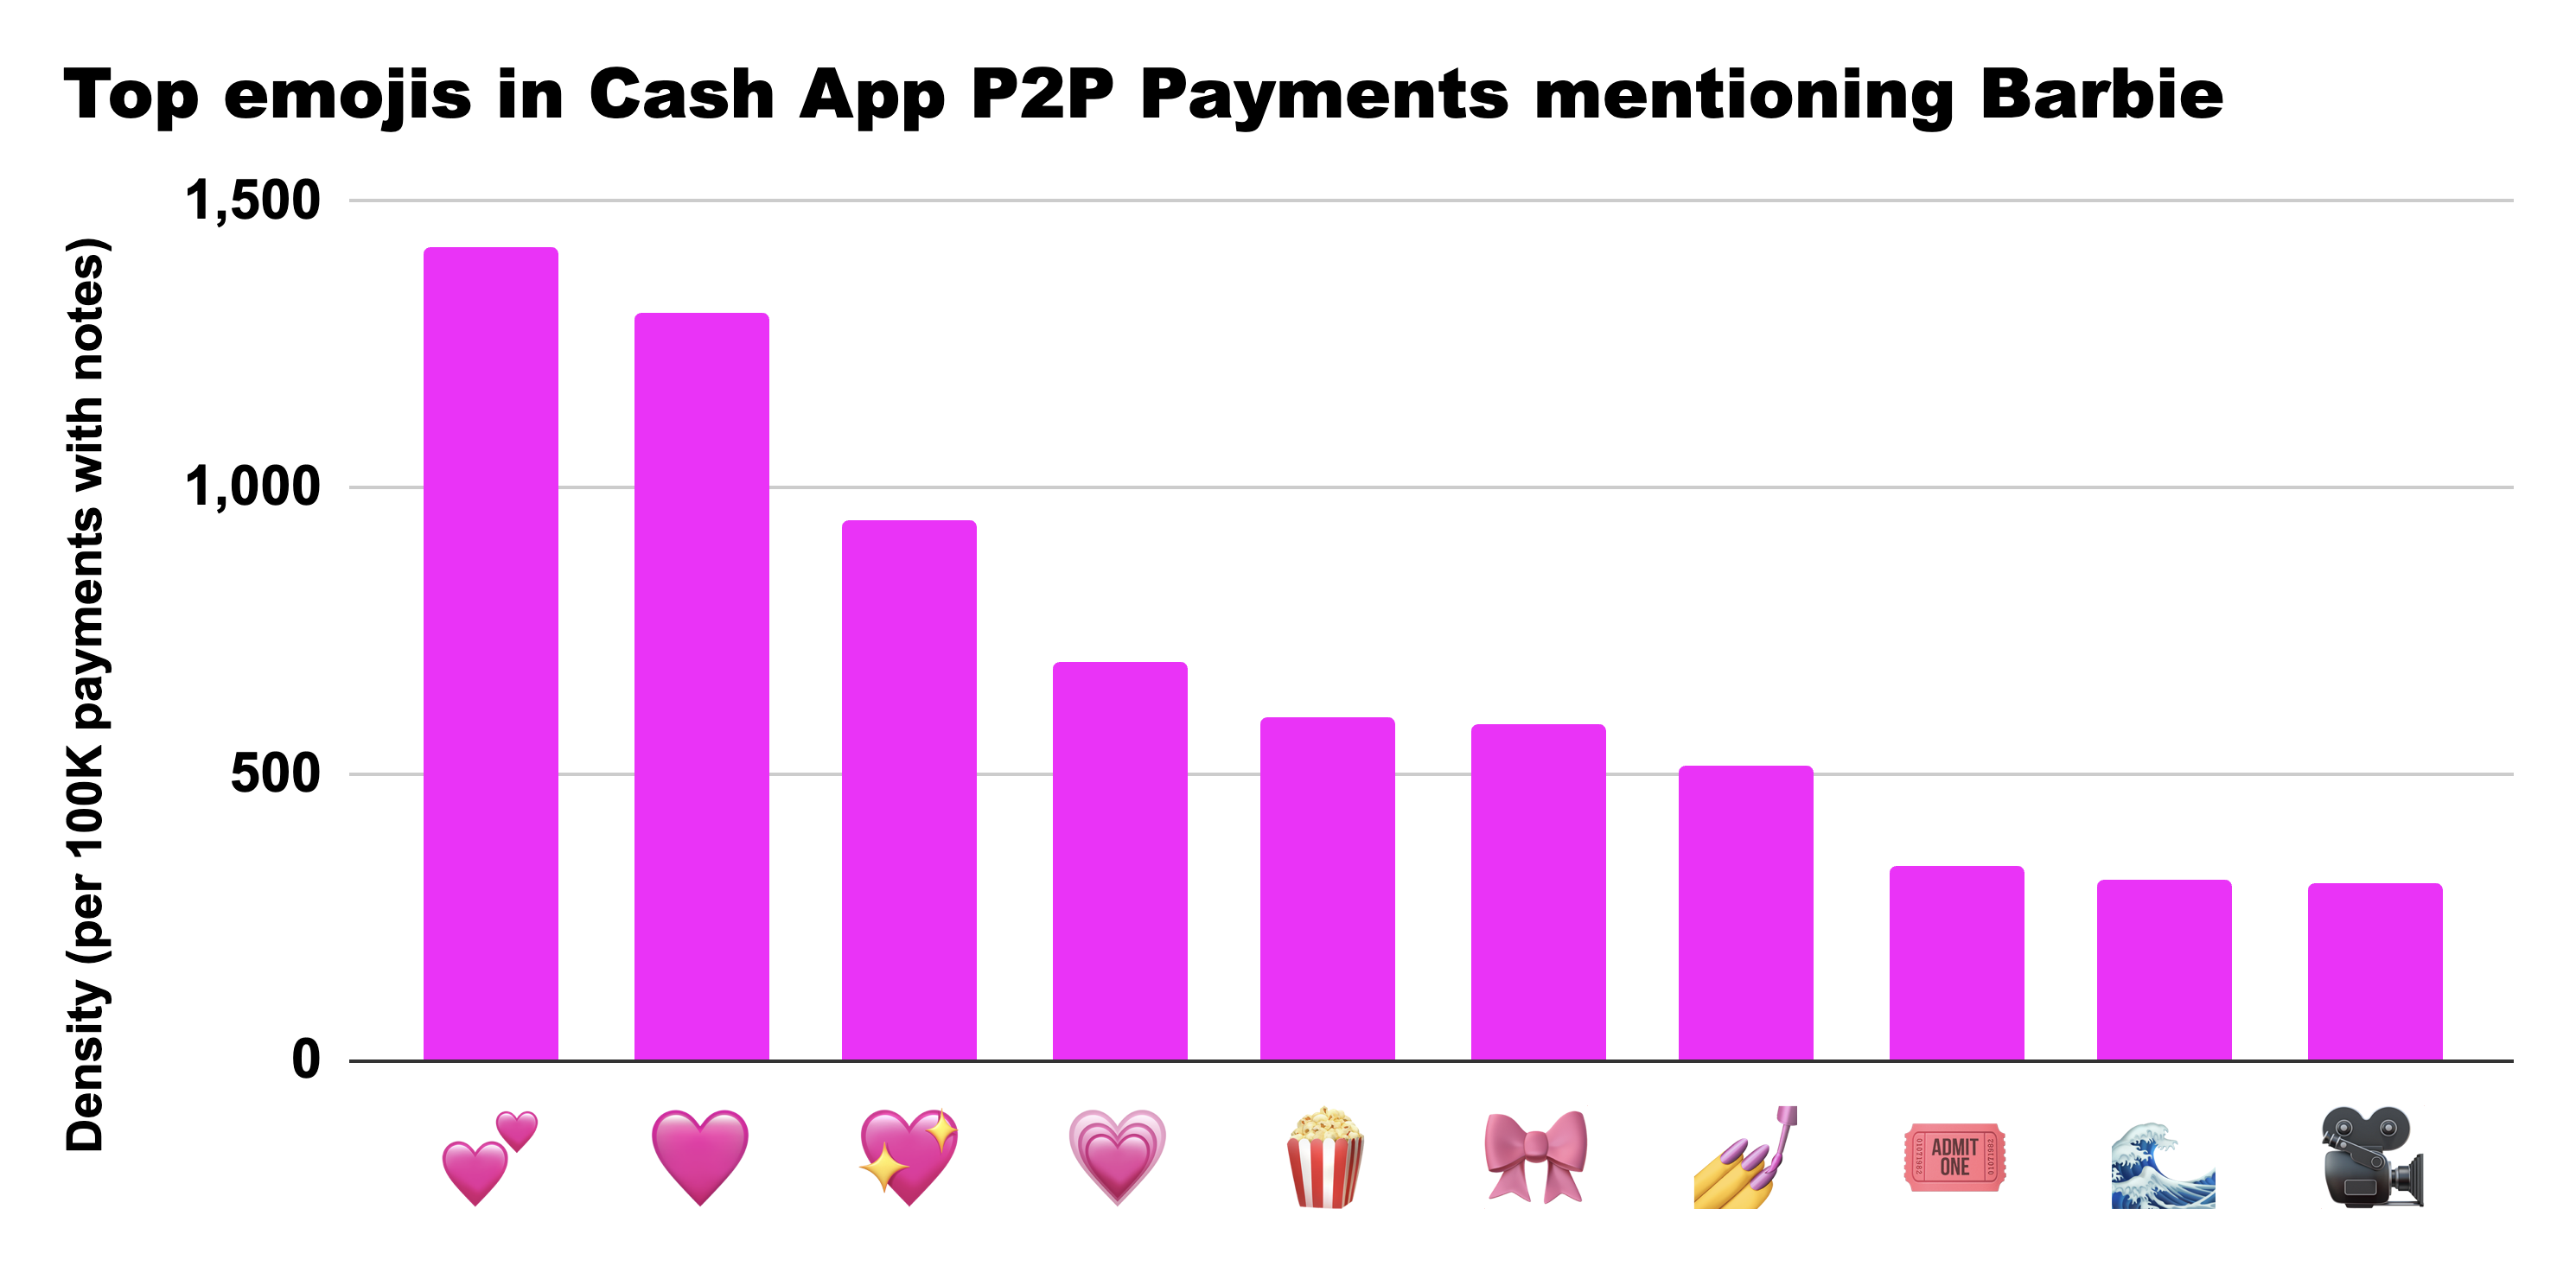
Lastly, we can also look at top emojis in payments mentioning each film. For Barbie, four of the top ten emojis are variations of pink hearts, with the pink bowtie and nail polish rounding out the aesthetic, as well as the movie camera, movie ticket, popcorn, and sea (“beach”) emojis.
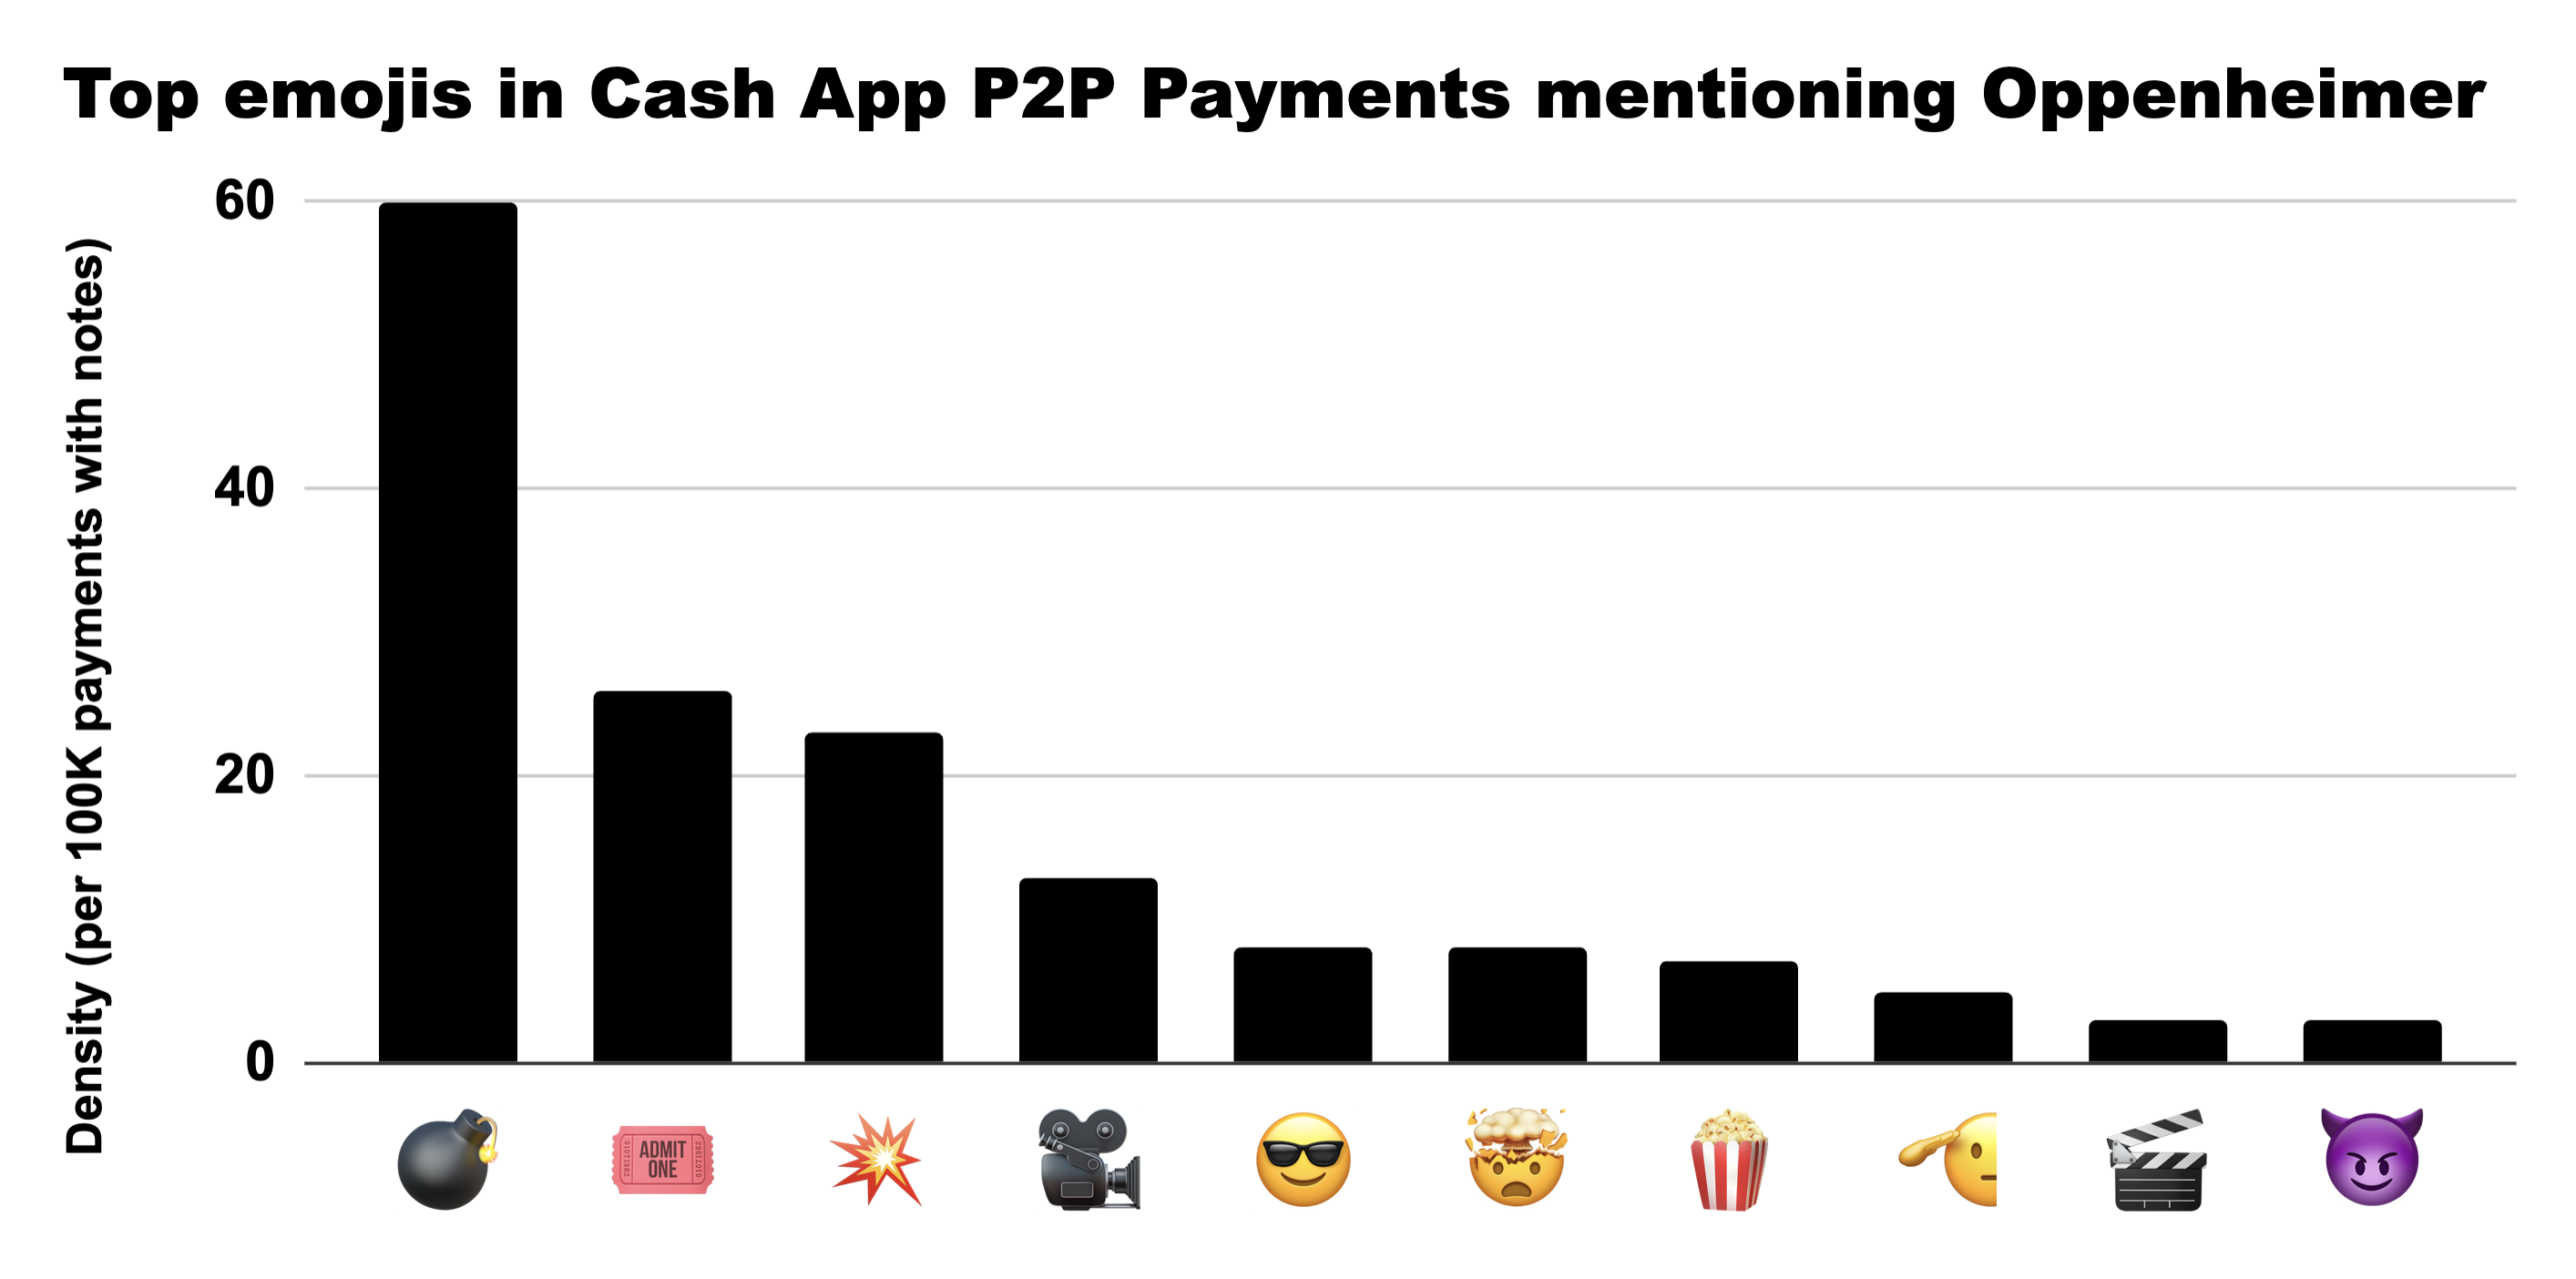
The top emojis in payments mentioning Oppenheimer are a bit less happening - and also interestingly, payments for Oppenheimer are also much less likely to include emojis overall.
Conclusion
We see this analysis as a fun proof of concept demonstrating that we can contemporaneously detect significant cultural trends in Cash App data - using simple text matching and regular expressions. Future work might focus on more programmatically identifying other interesting examples of this phenomenon in our data using machine learning, (generative) artificial intelligence, and natural language processing. If you have any cool ideas for future work or feedback on this analysis, feel free to reach out at hamdanz@squareup.com.